Examples
Some basic usage of the Vondrak module.
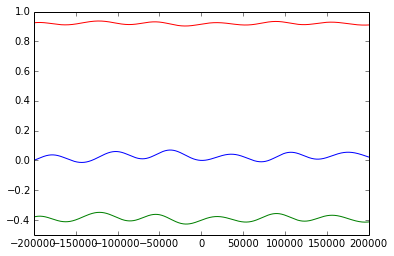
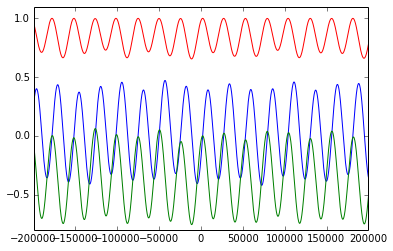
Periodicity
This first example, shows the periodicity of ecliptic and equatorial components of the matrix over 400000 years.
%pylab inline
Populating the interactive namespace from numpy and matplotlib
import vondrak as v
ecl_p_matrix_list = []
equ_p_matrix_list = []
year = arange(-200001.0, 200000.0, 100)
for y in year:
    p_ecl = v.ltp_PECL(y)
    p_equ = v.ltp_PEQU(y)
    ecl_p_matrix_list.append(p_ecl)
    equ_p_matrix_list.append(p_equ)

axis([-200000,200000,-.5,1])
plot(year, ecl_p_matrix_list)
show()
axis([-200000,200000,-.8,1.1])
plot(year, equ_p_matrix_list)
show()
Implementation
We then will show how to take an initial position (for Polaris) at J2000, and use the rotation matrix to find the new celestial coordinates computed for a new epoch.
The new positions (future or past of J2000) are optained by multiplying the coordinates of the standard epoch by the precession matrix. p₁ = P·p₀, where P is the below precession matrix and p₀ is the original position. The precession matrix is unitless.
P is recomputed for every epoch date.
We now have the new celestial coordinates p₁ expressed in the new reference epoch. The date is specified in the original computation of position in J2000 and then maintened when the rotation matrix is applied.
Additionally, we can convert the coordinates of another epoch to J2000 by inverting the precession matrix. We transpose this like so
Polaris
def position_matrix(ra=None, dec=None, x=None, y=None, z=None):
    if(ra == None or dec == None):
        ra  = 0.0
        dec = 0.0
    if(x==None or y ==None or z==None):
        x = cos(dec) * cos(ra)
        y = cos(dec) * sin(ra)
        z = sin(dec)
    return array([[x], [y], [z]])

def compute_polaris(year):
    import ephem
    polaris = ephem.star('Polaris')
    polaris.compute(str(year),epoch='2000')
    ra = polaris.a_ra
    dec = polaris.a_dec
    return position_matrix(ra=ra,dec=dec)
from ephem import hours as hrs
from ephem import degrees as deg

p0 = compute_polaris(2000)
(ra, dec) = v.ra_dec(p0)
print('RA: {}'.format(hrs(ra)))
print('DEC: {}'.format(deg(dec)))
print('cartesian position of Polaris in the year=2000, epoch=2000:')
x = p0[0][0]
y = p0[1][0]
z = p0[2][0]
print('{}\nthis vector has length {}'.format(
      (x,y,z),sqrt(x*x + y*y + z*z)))
RA: 2:31:47.10
DEC: 89:15:51.0
cartesian position of Polaris in the year=2000, epoch=2000:
(0.010127331660770541, 0.007897050033378511, 0.99991753347673784)
this vector has length 1.0
p0 = compute_polaris(2000)
print('The position of Polaris at J2000 is \n{}'.format(p0))
epj = 100000
P = v.ltp_PBMAT(epj) # Precession matrix, GCRS
p1 = compute_polaris(epj)
p1 = v.pdp(P, p1)
print('The new position of Polaris in 100000 years is \n{}'.format(p1))
The position of Polaris at J2000 is
[[ 0.01012733]
 [ 0.00789705]
 [ 0.99991753]]
The new position of Polaris in 100000 years is
[[ 0.31728427]
 [-0.15847663]
 [ 0.9349951 ]]
(ra, dec) = v.ra_dec(p0)
print('In hours of right ascension and degrees of declination')
print('The position of Polaris at J2000 is')
print(str(hrs(ra)),str(deg(dec)))
print('The new position of Polaris at 100000 years is')
(ra1, dec1) = v.ra_dec(p1)
print(str(hrs(ra1)),str(deg(dec1)))
In hours of right ascension and degrees of declination
The position of Polaris at J2000 is
('2:31:47.10', '89:15:51.0')
The new position of Polaris at 100000 years is
('-1:46:09.87', '69:13:38.5')
from mpl_toolkits.basemap import Basemap
width = 9000000
bm = Basemap(width=width, height=width, projection='aeqd',
lat_0=70.0, lon_0=280.0)
bm.drawparallels(np.arange(-80,81,10))
bm.drawmeridians(np.arange(-180,180,10))
# Position of Polaris at J2000 is p0
years = arange(-13001, 13000, 100)
for year in years:
P = v.ltp_PBMAT(year) # Precession matrix, GCRS
p_1 = compute_polaris(year)
p_1 = v.pdp(P, p1)
(ra1, dec1) = v.ra_dec(p_1)
x, y = bm(degrees(ra1), degrees(dec1))
if(year == years[0]):
bm.plot(x,y, marker='s', color='r')
elif(year == years[-1]):
bm.plot(x,y, marker='o', color='b')
else:
bm.plot(x,y, marker='.', color='black', markersize=4)
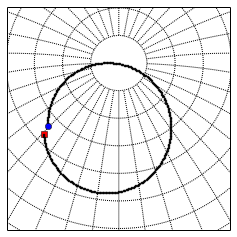
print('one cycle of precession is ~26 thousand years')
one cycle of precession is ~26 thousand years
width = 9000000
bm = Basemap(width=width, height=width, projection='aeqd',
lat_0=70.0, lon_0=280.0)
bm.drawparallels(np.arange(-80,81,10))
bm.drawmeridians(np.arange(-180,180,10))
for year in range(-200001, 200000, 100):
P = v.ltp_PBMAT(year) # Precession matrix, GCRS
p_1 = compute_polaris(year)
p_1 = v.pdp(P, p_1)
(ra1, dec1) = v.ra_dec(p_1)
x, y = bm(degrees(ra1), degrees(dec1))
bm.plot(x,y, marker='o', color='blue', alpha=0.3, ms=3)
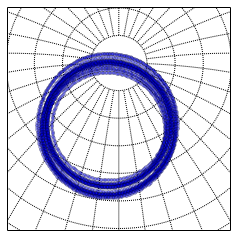
print('here is 400000 years of Polaris\' precession')
here is 400000 years of Polaris' precession